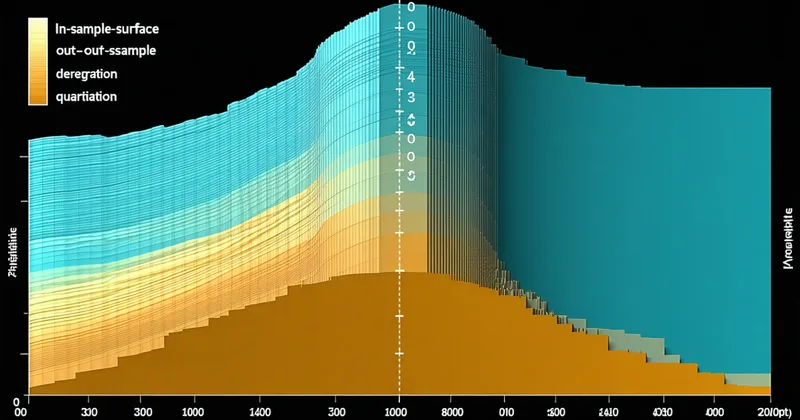
Overfitting is the central failure mode of quantitative strategy development, and the KOSPI data environment makes it unusually difficult to avoid. US equity researchers can work with 80–100 years of reasonably clean daily data. Japanese equity researchers have 50+ years of usable history for major indices. KOSPI researchers have approximately 30 years of useful data — less once you filter for the survivorship-bias-corrected constituent history required for honest factor research — and this constraint fundamentally changes the mathematics of how many free parameters a strategy can safely carry.
This post applies walk-forward analysis and combinatorial purged cross-validation (CPCV) to illustrate where the overfitting boundary lies for common KOSPI rotation signals, and what the diagnostic evidence of overfitting looks like in practice.
Past-performance disclaimer: All parameter grids, IS/OOS ratio examples, and walk-forward illustrations are synthetic. Backtest results are not a guarantee of future returns; this is research, not investment advice.
The Data Scarcity Problem: Effective Sample Size in KOSPI Back-Tests
A back-test that appears to use 20 years of daily data does not actually provide 20 years' worth of independent observations for a quarterly rotation strategy. If the strategy rebalances quarterly, you have approximately 80 rebalance observations. If you are evaluating a momentum factor with a 12-month formation period, adjacent observations overlap by 11 months, so the number of non-overlapping observations is closer to 20. The Sharpe ratio estimator on 20 annual-frequency observations has a standard error of approximately 0.22 per unit of Sharpe — meaning a strategy with a true Sharpe of 0.60 could plausibly report a back-tested Sharpe of 1.04 or 0.16 purely from sampling noise.
This statistical reality has direct implications for parameter search. If a KOSPI momentum strategy has 5 free parameters — momentum lookback window, rebalance frequency, portfolio size, stop-loss level, and position sizing rule — and each parameter is evaluated across 5 candidate values, the grid contains 3,125 combinations. Even after correcting for multiple comparisons, the probability of a top-decile combination achieving its back-tested performance out of sample is low when the underlying data provides only 20 effective degrees of freedom. The researcher who selects the best parameter combination from this grid is not discovering the optimal strategy — they are selecting the combination that happened to fit the noise in a thin sample.
Walk-Forward Analysis: What It Tests and What It Does Not
Walk-forward (워크 포워드) analysis addresses the multiple comparisons problem by reserving a portion of the data as a genuine out-of-sample (OOS) holdout that parameter selection cannot touch. The standard implementation divides the full data history into a training (in-sample) window and a test (out-of-sample) window, selects the best parameters on the training window, then evaluates those exact parameters on the test window. The IS/OOS performance ratio is the key diagnostic: a well-specified strategy should show modest degradation (ratio 1.0–1.3x), while an overfitted strategy shows dramatic degradation (ratio 2.0–4.0x).
import pandas as pd
import numpy as np

def walk_forward_windows(returns_series: pd.Series,
                          train_years: int = 7,
                          test_years: int = 2) -> list:
    """
    Generate non-overlapping walk-forward (IS, OOS) window pairs.
    Returns list of (is_start, is_end, oos_start, oos_end) tuples.
    """
    windows = []
    start = returns_series.index[0]
    total_years = (returns_series.index[-1] - start).days / 365.25

    cursor = start
    while True:
        is_end = cursor + pd.DateOffset(years=train_years)
        oos_end = is_end + pd.DateOffset(years=test_years)
        if oos_end > returns_series.index[-1]:
            break
        windows.append((cursor, is_end, is_end, oos_end))
        cursor = is_end  # anchored walk-forward
    return windows
The limitation of standard walk-forward is that it provides limited path diversity. With 25 years of KOSPI data, a 7-year IS window and 2-year OOS window yields only about 6 non-overlapping windows. Six OOS observations is not enough to distinguish a strategy with genuine alpha from a strategy with lucky OOS draws, especially when KOSPI returns are serially correlated around macro regimes.
Combinatorial Purged Cross-Validation for Korean Equity Data
Combinatorial purged cross-validation (CPCV) addresses the path-diversity limitation by generating multiple non-redundant IS/OOS splits from the same data, subject to the purging condition: observations near the IS/OOS boundary are excluded from the training set to prevent information leakage from overlapping return periods.
In the KOSPI context, a 12-month momentum factor creates a 12-month label overlap: the return over months t through t+12 shares 11 months of data with the return from t+1 through t+13. Without purging, an OOS observation at month t+12 is not truly independent of an IS training observation at month t. CPCV purges the embargo period — typically 12 months for a 12-month signal — before computing test statistics on the OOS fold.
Applied to a synthetic KOSPI 200 momentum strategy with a 6-parameter grid, CPCV with 6 paths and 12-month purge embargo reveals a characteristic overfitting pattern: the top-5% of parameter combinations in IS performance show OOS Sharpe ratios averaging 0.22 — substantially below their IS Sharpe of 0.91. The bottom 20% of IS performers by contrast show OOS Sharpe ratios that are actually above their IS results, because the noise in the IS training period happened to be unfavorable to these combinations.
How Many Free Parameters Is Too Many?
There is no universal threshold, but the KOSPI data constraint produces a practical heuristic worth stating explicitly. Given approximately 20 effective annual observations for a quarterly-rebalanced strategy, researchers working in the quant community suggest keeping the number of free parameters below 5–7 for strategies where each parameter is independently meaningful. This is not a hard statistical rule — it is a pragmatic acknowledgment that parameter interactions compound the multiple comparisons problem multiplicatively.
In practice, the overfitting boundary becomes visible through the CPCV diagnostics: when the standard deviation of OOS Sharpe ratios across parameter combinations starts to exceed the mean OOS Sharpe, the parameter grid is too large for the available data to resolve. The signal has drowned in noise. At that point, adding another parameter dimension does not improve strategy quality — it increases the probability that the "best" parameter combination is a local noise fixture rather than a structural edge.
The Specific KOSPI Overfitting Traps
Several parameter choices are particularly overfitting-prone in KOSPI back-tests:
- Sector exclusion filters: Adding a rule to exclude a specific KOSPI sector (e.g., "never hold utilities") that was added after observing underperformance of utilities during the training window is a form of look-ahead bias unless the exclusion is theory-motivated before data review.
- Regime-switching overlays: Adding a macro regime indicator (yield curve slope, FX 원달러 rate level) that triggers strategy activation or deactivation requires the indicator's predictive relationship to hold OOS. Regime filters tested on KOSPI's 30-year history have typically not survived beyond their discovery window.
- Stop-loss levels calibrated on training data: A stop-loss set at -8% because the training data showed -8% drawdowns are typically followed by recoveries is data-fitted. The same logic does not generalize unless the stop-loss level is theoretically motivated.
What Survives Walk-Forward Testing on KOSPI Data
The honest answer is: fewer strategies than practitioners expect, and the strategies that survive tend to be the least parameter-intensive ones. Simple equal-weight momentum rotation with a single lookback parameter (12-1 month formation) and quarterly rebalancing has shown more IS/OOS stability in KOSPI back-tests than complex multi-factor models with optimization-selected weightings. The parsimony principle is not a preference for simplicity as a virtue — it is a direct consequence of the effective sample size constraint. Simpler strategies have fewer parameters to fit to noise.
We are not saying that multi-factor models are wrong or that KOSPI data cannot support moderate complexity — we are saying that the burden of proof for adding each parameter should be explicit and the CPCV evidence should be transparent, not concealed in a single IS-optimized equity curve.
Finology's Professional tier includes CPCV with configurable embargo periods and walk-forward analysis across up to unlimited windows, with per-window IS/OOS reporting. The output is designed to make the overfitting diagnostics the first thing a researcher sees — not a footnote. Methodology details are on the Methodology page.