How Finology models KOSPI execution
Transparent, documented, and testable. Every modeling decision is explained here — including its limitations. Finology is a back-testing research tool. It does not provide investment advice, does not execute orders, and is not a financial services provider under the Korean Financial Investment Services and Capital Markets Act (FSCMA).
Data sources
Finology sources equity data from publicly available OHLCV feeds for KOSPI 200 and KOSDAQ constituents. Price history is cleaned for stock splits, rights issues, and corporate restructuring events using KRX corporate action announcements.
Constituent list changes — additions and removals from KOSPI 200 — are sourced from KRX official index reconstitution announcements. The engine applies these changes prospectively: a stock removed from KOSPI 200 in March 2018 is included in the universe for all back-test dates before that removal, and excluded after it.
Dividend data is sourced from KRX Data Service records. The data cleaning pipeline handles missing announcements, delayed filings, and split-adjusted dividend amounts. Known data gaps (primarily pre-2005 tick records) are documented in the Limitations section below.
| Source | Coverage |
|---|---|
| OHLCV price history | 2005–2024 |
| KOSPI 200 constituent lists | 2005–present |
| Dividend records (KRX) | 2003–present |
| Tick data (bid-ask) | 2008–present |
Slippage modeling
Finology models slippage as the difference between the theoretical mid-price at the time of order entry and the estimated fill price given the order's size and the prevailing bid-ask spread.
Bid-ask spread is estimated using a volume-weighted reconstruction from available tick data. For periods where full order book depth is unavailable (pre-2008), the model falls back to an empirically calibrated spread estimate based on market capitalisation tier and average daily turnover.
The fill price model applies the following logic for a simulated sell order of size Q shares:
- Determine the minimum trade lot L for the security on that date (1, 10, or 100 shares depending on price tier)
- Round Q down to the nearest multiple of L — this is the actually executable size
- Estimate the effective bid price at quantity Q using the depth-adjusted spread curve
- Apply a linear market impact coefficient calibrated to KOSPI 200 mid-cap liquidity profiles
Boundary conditions: the model assumes all fills complete within the same session. It does not model multi-session fills or block trade mechanics. For strategies with position sizes below ₩50M per name, this assumption is defensible for most KOSPI 200 constituents.
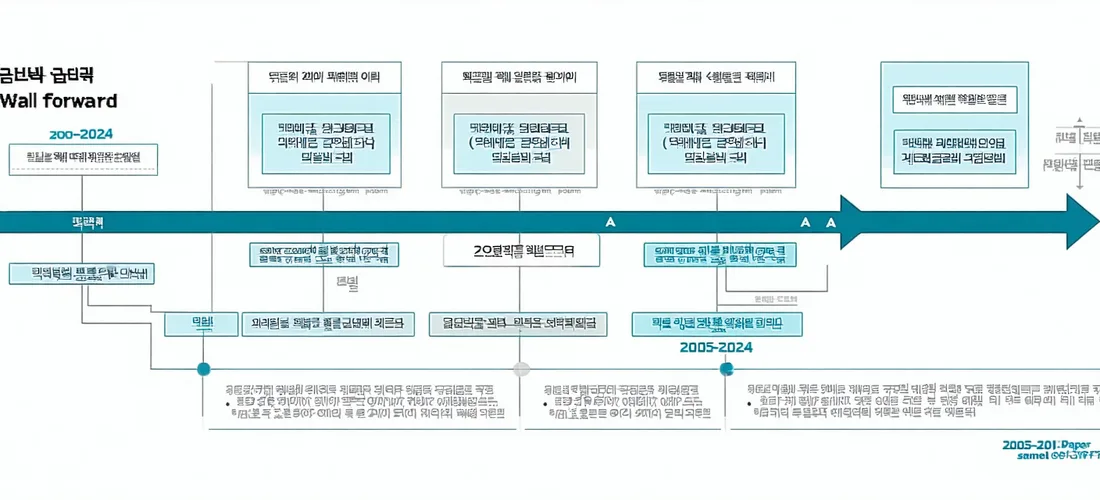
Walk-forward analysis and overfitting prevention
Finology implements Combinatorial Purged Cross-Validation (CPCV) as described by Lopez de Prado (2018). The method constructs multiple training/validation splits across the available data window, purging observations that could leak future information into the training set.
For the default 12-window configuration (Analyst tier), the engine divides the full data window into 12 equal-length segments. Each segment is used as an out-of-sample test window in sequence, while the preceding segments form the training set. The reported performance statistics are computed exclusively on the out-of-sample segments.
Interpretation guidance: a strategy whose Sharpe ratio degrades substantially from in-sample to out-of-sample performance has likely been overfit to historical data patterns. Finology computes the IS/OOS ratio for each performance metric and flags strategies where the degradation exceeds configurable thresholds.
Walk-forward results represent historical simulation outcomes, not a forecast of live performance. Even a strategy that passes all out-of-sample windows may underperform in live deployment. Back-test results are not a guarantee of future returns.
Known limitations and epistemic boundaries
We document limitations as precisely as capabilities. A back-test that flatters is not useful research.
What Finology is not: Finology is not an investment adviser, is not a registered brokerage, and does not manage or recommend the allocation of any capital. Results produced by the platform are simulations of past market conditions. They are not projections, not forecasts, and not endorsements of any trading strategy. You are solely responsible for any investment decisions you make.
- Intraday fill approximation: The slippage model assumes fills complete within a single KST session (09:00–15:30 KRX close) and applies volume-weighted average-spread estimates for pre-2008 periods where tick data is sparse. Strategies with very large position sizes relative to daily turnover (above ₩100M per name) will see underestimated market impact.
- Pre-2005 data gaps: KOSPI constituent and corporate action data before 2005 is not available in the platform. Back-tests are constrained to the 2005–present window. The 2004 KOSPI credit-card crisis period and the 2003 SK Global accounting shock are not captured.
- Corporate action edge cases: Stock splits, rights issues, and standard constituent replacements are handled. Complex restructurings — conglomerate spin-offs (물적분할/인적분할), preferred-to-common conversions — may have residual modeling errors that the data cleaning pipeline does not fully resolve.
- Options overlay not modeled: Protective puts, covered calls, and other options-based equity overlays are outside the current scope. The platform models linear long-only and long-short equity rotation strategies only. Derivatives positions are not back-testable.
- KOSDAQ liquidity extremes: For KOSDAQ small-caps below ₩5B average daily turnover, the slippage model's market-impact coefficients are calibrated to mid-cap liquidity profiles and become less reliable. Results for strategies heavily concentrated in illiquid KOSDAQ names carry wider modeling error bounds.
- Past performance is not predictive: No back-test result — regardless of Sharpe ratio, maximum drawdown, or out-of-sample walk-forward performance — constitutes a prediction of how a strategy will perform in live trading. Korean equity market structure, regulatory environment, and macroeconomic regime can change in ways not captured by historical data.
Questions about methodology?
Contact the research team directly at [email protected]. We respond to methodology questions from researchers and analytically engaged Korean retail investors. We do not provide personal investment advice in any form.
Contact research team