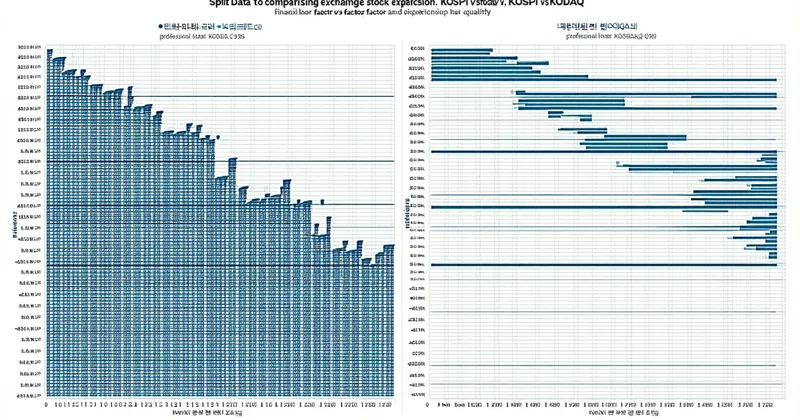
The temptation when building a Korean equity back-test is to treat KOSPI 200 and KOSDAQ as two columns in the same spreadsheet — separate universes, same factor logic, same rebalancing cadence, similar expected outcomes. That treatment is incorrect in ways that matter for execution, for signal construction, and for regime interpretation. KOSDAQ is not a smaller KOSPI. It is a different microstructure environment with different factor behavior, and running the same rotation parameters across both without adjustment is a form of implicit overfitting: the parameters were calibrated for one regime and are being exported to another without evidence they transfer.
This post examines the empirical differences in factor behavior, data density, bid-ask spread impact, and regime length between KOSPI 200 and KOSDAQ, drawing on the structural characteristics of each market rather than any single back-test result.
Past-performance disclaimer: All factor comparisons and back-test illustrations use synthetic parameter examples. Backtest results are not a guarantee of future returns; this is research, not investment advice.
Data Density: Why KOSDAQ Is Harder to Back-Test Reliably
KOSPI 200 has approximately 200 constituents with daily OHLCV data available back to the mid-1990s, though clean, corporate-action-adjusted data is generally reliable from 2002–2005 onward. The universe is stable: the quarterly reconstitution (구성종목 변경) typically changes 5–15 names per cycle, and the outgoing names are large enough to have clean trading histories.
KOSDAQ presents a fundamentally different data challenge. The KOSDAQ market lists over 1,500 companies; any sub-universe selection (say, KOSDAQ 150 or a custom liquidity-filtered universe) must be constructed from a constituent history that KRX provides but that most retail data providers do not deliver pre-cleaned. Survivorship bias (생존 편의) is severe: KOSDAQ delisting rates have historically averaged 3–6% per year, concentrated in micro-caps and early-stage companies. A back-test that uses today's KOSDAQ 150 constituent list to define the back-test universe and then pulls their historical prices is pulling only the survivors — companies that were listed and liquid enough to persist to the present — and systematically omitting the delisted names that would have been in the universe at earlier dates.
The practical consequence is that survivorship bias inflates KOSDAQ back-test returns significantly more than KOSPI 200 back-tests. The surviving KOSDAQ names disproportionately exhibit the very characteristics — positive momentum, improving fundamentals — that factor rotation strategies favor. The excluded delisted names are the ones that reversed hard and were eventually removed. Without a point-in-time constituent history (which KRX Data Service can provide for KOSDAQ 150), any KOSDAQ factor back-test result should be viewed with substantial skepticism.
Factor Behavior: Momentum and Value on Different Regimes
Momentum (모멘텀) in KOSPI 200 operates in a market where the top 10 names by weight account for roughly 40–45% of the index. When Samsung Electronics (반도체 sector) runs a strong momentum cycle, it drags the index-level momentum factor along with it. The factor dispersion — the spread between top-quintile and bottom-quintile momentum returns in the KOSPI 200 universe — is compressed by this concentration. Individual stock momentum in KOSPI 200 has historically shown meaningful but volatile alpha, with notable regime breaks around the 2008 crisis, the 2012–2015 low-volatility period, and the 2020–2021 2차전지 (secondary battery) surge.
KOSDAQ momentum exhibits higher dispersion: the inter-quintile spread between winner and loser portfolios tends to be wider on a gross basis, but the spread is also more volatile and subject to sharper reversals. KOSDAQ stocks are more theme-driven — biotechnology, game developers, 2차전지 component suppliers — which means momentum signals amplify when a theme is in play and decay violently when the theme rotates. A momentum strategy calibrated on 12-1 month formation that works reasonably in KOSPI 200 may show extreme performance variance in KOSDAQ depending on whether a dominant theme cycle is active during the back-test window.
Value Factors and the KOSDAQ Discount
Value factors (P/B, P/E, EV/EBITDA) in KOSDAQ face a structural problem: many KOSDAQ names trade at persistent discounts for structural governance reasons — concentrated founding-family ownership, limited institutional coverage, and thin analyst following. A low P/B KOSDAQ stock is not necessarily a value opportunity; it may simply be a company where the market has correctly identified a permanent discount for governance risk (지배구조 할인). Running a standard value rotation on KOSDAQ without adjusting for this structural discount will systematically over-rotate into low-quality cheap names.
Bid-Ask Spread Impact: The Execution Asymmetry
KOSDAQ's thinner liquidity has a direct effect on execution cost that factor back-tests routinely ignore. The median bid-ask spread for KOSPI 200 large-caps runs 2–5 basis points during normal trading hours; for KOSDAQ mid-caps, the median is closer to 15–40 basis points, with tail observations exceeding 100 basis points for less-liquid names outside the KOSDAQ 150.
This asymmetry means the gross factor alpha required to justify the same rotation frequency is materially higher on KOSDAQ. Consider: a monthly-rebalanced momentum strategy with 50% annual turnover costs approximately 12–25 basis points per year in bid-ask crossing for a KOSPI 200 mid-cap universe. The same strategy on a KOSDAQ liquidity-filtered universe costs 60–120 basis points — a 5x increase in transaction drag. The factor needs to generate substantially more gross alpha to survive this load.
import pandas as pd
import numpy as np

# Synthetic spread assumptions for KOSPI vs. KOSDAQ universes
spread_by_universe = {
    'kospi200_top50':    0.0004,  # 4 bps — large-cap KOSPI
    'kospi200_mid':      0.0012,  # 12 bps — mid-cap KOSPI 200
    'kosdaq150_top50':   0.0018,  # 18 bps — KOSDAQ 150 upper tier
    'kosdaq_extended':   0.0045,  # 45 bps — broader KOSDAQ filter
}

annual_turnover = 0.5  # 50% portfolio turnover per year

for universe, half_spread in spread_by_universe.items():
    round_trip = half_spread * 2
    annual_cost = round_trip * annual_turnover
    print(f"{universe}: {annual_cost*100:.2f}% annual spread cost")
Regime Length Differences and Their Back-Test Implication
A factor regime in KOSPI 200 typically persists for 6–18 months — long enough that a quarterly rebalance catches meaningful portions of trend cycles. KOSDAQ theme regimes tend to be shorter and sharper: the 2차전지 supercycle in KOSDAQ accelerated from mid-2020 and largely peaked within 18 months; the bio/pharma theme of 2015–2016 similarly compressed and inverted quickly. Shorter regime length means that a factor signal computed on 12-month formation is often already stale by the time a quarterly rebalance acts on it in KOSDAQ — the signal was generated by a cycle that has already turned.
We are not saying KOSDAQ factor rotation is unworkable — we are saying that parameter sets designed for KOSPI 200 regime dynamics should not be assumed to transfer to KOSDAQ without separate calibration and walk-forward validation. A 12-month momentum lookback with quarterly rebalance may be a reasonable starting point for KOSPI 200; for KOSDAQ, a 6-month lookback with monthly rebalance is worth testing as a separate configuration rather than forcing the KOSPI parameters onto a structurally different market.
Practical Guidance for Cross-Universe Strategies
For practitioners considering a combined KOSPI + KOSDAQ rotation, three structural choices affect research quality significantly:
- Point-in-time constituent data: Essential for KOSDAQ, non-optional. Without it, the survivorship bias issue makes KOSDAQ factor estimates unreliable. KRX Data Service provides historical KOSDAQ 150 constituent lists with entry and exit dates.
- Separate slippage parameters per universe: KOSPI 200 and KOSDAQ mid-caps have materially different spread profiles. Using a single blended slippage assumption understates KOSDAQ costs and overstates KOSPI costs simultaneously.
- Walk-forward validation separated by universe: Combine-then-validate is less informative than validate-by-universe then combine. If the KOSPI 200 walk-forward shows stable IS/OOS ratio at 1.2x and the KOSDAQ walk-forward shows 2.1x, the strategy logic works on KOSPI and is noise-fitting on KOSDAQ — a conclusion you lose if you average the two.
Finology's back-testing platform supports separate universe configurations for KOSPI 200 and KOSDAQ, with universe-specific slippage parameters, point-in-time constituent histories, and independent walk-forward validation outputs. The Methodology page describes the constituent data sourcing and survivorship bias correction in detail.