The Finology back-testing engine
Every component built for KOSPI and KOSDAQ reality: KRX lot sizes, T+2 settlement, 배당락 mechanics, and 20 years of survivorship-bias-adjusted constituent history. This is a research platform — not a brokerage and not an execution venue.
Platform architecture
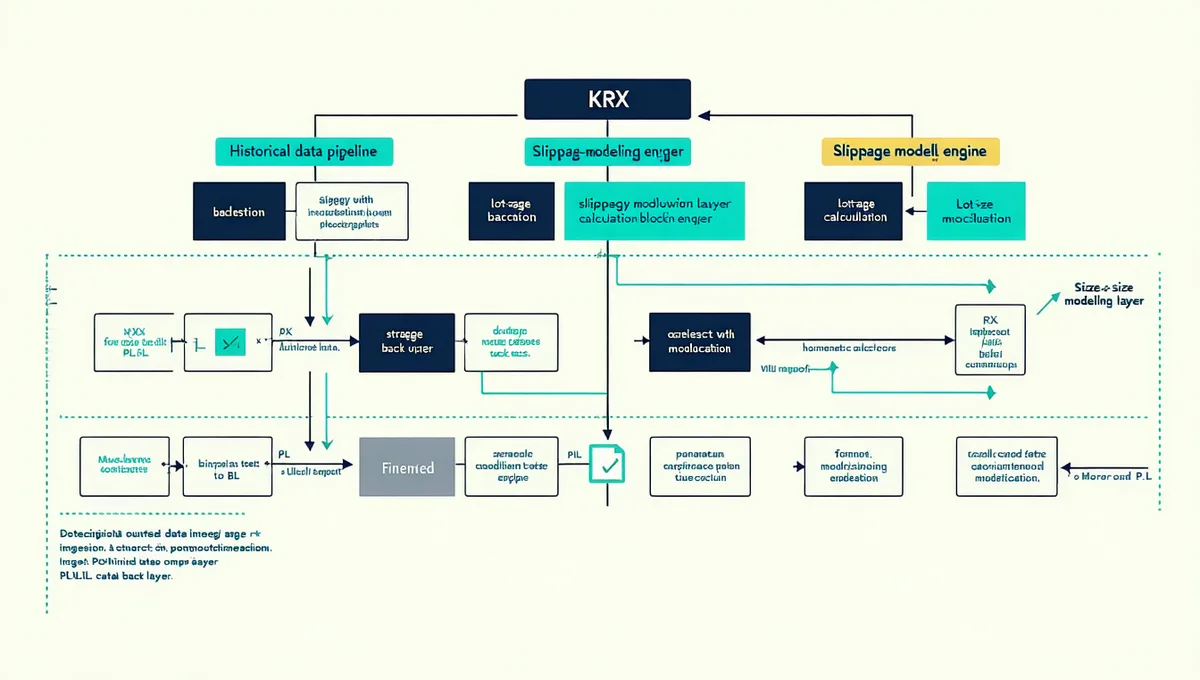
Finology operates a three-layer data pipeline. The first layer ingests KRX historical data: OHLCV price history, corporate action records, dividend announcements, and constituent list changes for KOSPI 200 and KOSDAQ from 2005 to present.
The second layer runs the slippage modeling engine. For each simulated trade, it reconstructs approximate bid-ask surfaces from tick data, applies KRX lot-size constraints, and estimates fill price at your specified order size. This is the layer that separates a Finology back-test from a mid-price approximation.
The third layer handles strategy back-test execution: factor signal application, rebalancing scheduling against the KRX trading calendar, P&L attribution, and output formatting for PDF and JSON export.
Lot-level slippage: how it works
KOSPI trades are constrained by lot-size tiers. Large-cap KOSPI 200 stocks trade in lots of 1 share; many mid-caps have minimum trade units of 10 or 100 shares. Ignoring lot constraints overstates the number of shares you can fill in a given order, understating slippage.
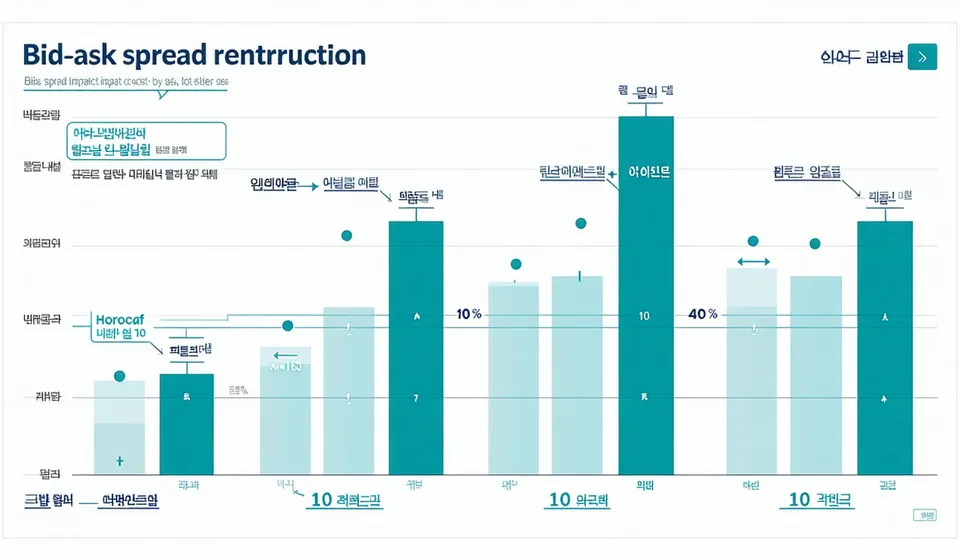
Finology reconstructs approximate bid-ask spreads from historical tick data using a volume-weighted spread estimation model. At each simulated trade, the engine determines:
- The minimum lot unit for the security on that date
- The approximate bid-ask spread at your order size
- The estimated fill price given available liquidity depth
The result is a fill-price estimate that reflects the cost a real investor at retail scale would have experienced — not the theoretical mid-price.
KRX dividend calendar alignment
The KRX operates on a T+2 settlement cycle. Corporate actions including dividend ex-dates follow this calendar precisely. Korean companies report fiscal years ending December 31, which concentrates ex-dividend dates in the last two weeks of December and first week of January.
Finology maps every dividend event in the historical constituent record to its correct KRX settlement date. When your rotation signal triggers a sell on December 28, the engine applies the correct dividend-adjusted close price — not an end-of-month approximation that misses the clustering effect entirely.
This adjustment changes annual return attribution by 30–80 bps in high-dividend years. Over a 20-year back-test window, the compounded difference between a correctly-aligned strategy and a naive approximation can exceed 8–15% in total return.
Configuring your universe
Finology supports three universe configurations: KOSPI 200, KOSDAQ, or a user-defined sub-universe filtered from either. Universe selection determines which constituent lists and corporate action records the back-test engine loads.
Survivorship-bias correction is applied automatically. The engine loads constituent lists as they existed on each back-test date, not the current list — so your results reflect the index composition an investor actually faced, including stocks that were subsequently delisted or removed from the index.
Custom filters allow you to restrict by sector (using KRX GICS classification), market capitalisation tier (top 50 / 100 / 150 / 200), or average daily turnover threshold to model liquidity-constrained strategies.
KOSPI 200
Full constituent history from 2005. KRX lot sizes, T+2 settlement, dividend events — all modeled correctly.
KOSDAQ
Higher volatility, thinner liquidity. Factor dispersion significantly different from KOSPI 200 — correct regime modeling is essential.
Custom Sub-Universe
Upload your own ticker list or apply filters. Test a sector-concentrated strategy against its exact investment universe.
Run your first back-test
Free Starter tier. No credit card required.
Start Back-TestingHistorical back-test results are not a guarantee of future returns. Finology models past KRX execution mechanics for research purposes.