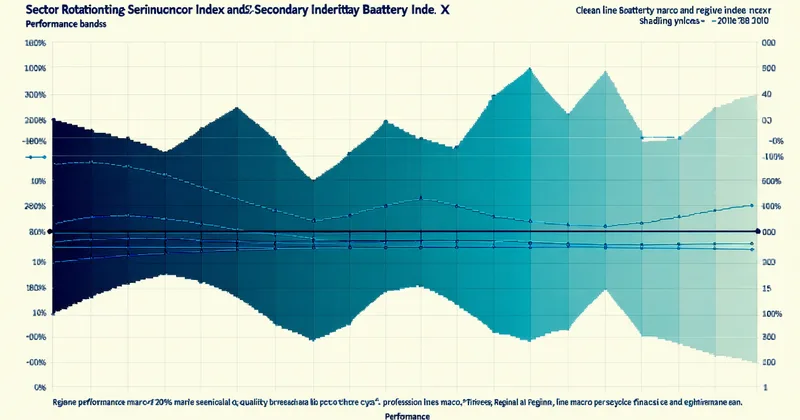
KOSPI 200 index concentration is a fact that every Korea-focused equity researcher must confront early. Samsung Electronics alone accounts for 20–25% of the index depending on the measurement date; when you add SK Hynix, the semiconductor (반도체) cluster reaches 27–32% of index weight. Add LG Energy Solution, SK Innovation, and Samsung SDI — the primary members of the 2차전지 (secondary battery) cluster — and these two sector groups together represent over 35% of KOSPI 200 at typical weights. Any systematic rotation signal applied to KOSPI 200 is, to a significant degree, a signal about the relative positioning between these two concentrated sector groups.
This post examines how momentum-based rotation signals have behaved between the semiconductor cluster and the secondary battery cluster across three distinct macro cycles since 2010, what the back-test evidence shows about signal timing, and where the concentration risk creates structural challenges for any rotation model.
Past-performance disclaimer: Back-test results and cycle characterizations in this article use synthetic parameter illustrations. Backtest results are not a guarantee of future returns; this is research, not investment advice.
Defining the Two Sector Clusters
For back-test purposes, defining the semiconductor and secondary battery clusters requires clarity about what is in each group and how the composition has changed over the back-test window.
The semiconductor cluster is relatively stable: Samsung Electronics (삼성전자) and SK Hynix (SK하이닉스) dominate, with supporting equipment names like Hanmi Semiconductor and WONIK IPS constituting a smaller fringe of the cluster by weight. Samsung Electronics specifically has undergone its own corporate actions — the 2017 인적분할 (physical split) that separated Samsung C&T's holdings structure — which requires careful data-layer handling to avoid artificial back-test breaks. For a rotation model, it is usually cleaner to define the semiconductor cluster by GICS sub-industry (Semiconductors and Semiconductor Equipment) or by a custom sector definition aligned to KRX sector codes (업종 코드 151, 152), rather than using market-cap-weighted inclusion that changes with Samsung's absolute price level.
The secondary battery cluster has evolved considerably since 2010. LG Energy Solution (LG에너지솔루션) did not list on KOSPI until January 2022; prior to that listing, the battery exposure in KOSPI 200 was represented through parent companies LG Chem (LG화학) and SK Innovation (SK이노베이션), which have substantial non-battery businesses. A back-test claiming to capture the "secondary battery sector rotation" before 2022 is necessarily using a proxy — LG Chem's total-company return, for instance, not pure battery EBITDA. This proxy noise is material and should be disclosed in any strategy description.
Three Macro Cycles: Structural Context
For back-test interpretation, three broad phases are identifiable across the 2010–2024 window. These characterizations are structural observations for context, not forecasting claims:
2010–2016 — semiconductor dominance, battery build-phase: Samsung and SK Hynix drove KOSPI through multiple memory capex cycles. The battery sector in this period was still building its supply chain presence; EV adoption was pre-mass-market globally and Korea's battery cluster was more export-supply-chain than domestic-theme. A momentum rotation strategy in this window would have been persistently long semiconductors relative to the battery proxy.
2017–2021 — 2차전지 emergence and supercycle: Global EV acceleration drove the battery cluster into a multi-year momentum regime. The period 2020–2021 specifically saw the battery cluster significantly outperform the semiconductor cluster on absolute return, as global EV demand narrative drove Korean battery names to extended valuations. A momentum signal calibrated on 12-1 month formation would have rotated into batteries with strong signal conviction by mid-2020.
2022–2024 — regime reversal and semiconductor AI cycle: The battery cluster corrected sharply from 2022 highs as EV demand slowed relative to supply build-out expectations. Concurrently, the global semiconductor AI cycle — high-bandwidth memory demand driven by GPU server builds — restored semiconductor cluster outperformance. A rotation model would have faced a difficult regime transition: the battery momentum signal was still positive into early 2022, generating what turned out to be peak-cycle long positioning before the reversal.
What Momentum Signals Show Across These Cycles
A synthetic back-test of a sector-rotation overlay between the semiconductor and secondary battery clusters — using simple 12-1 month momentum as the rotation signal, quarterly rebalance, and equal-weight allocation to the higher-ranked cluster — shows a characteristic performance profile across the three periods.
The strategy performs well during clear regime trends: the semiconductor phase (2010–2016) and the initial battery ascent (2020–2021) are both captured by the lagged momentum signal with reasonable timing. The performance degradation occurs at regime inflection points. The 2022 battery peak is a particularly illustrative case: the 12-1 month formation period ending in Q4 2021 showed the battery cluster as the clear momentum winner. The Q1 2022 rebalance signal would have been long batteries into what turned out to be the sector peak. With a one-quarter holding period, the drawdown from that position is fully realized before the next rebalance rotation signal fires.
import pandas as pd

# Synthetic sector momentum rotation signal
# sector_returns: DataFrame with columns ['semiconductor', 'battery'], monthly returns

def compute_sector_rotation_signal(sector_returns: pd.DataFrame,
                                    lookback_months: int = 11,
                                    skip_months: int = 1) -> pd.Series:
    """
    12-1 month momentum signal for two-sector rotation.
    Returns: series of 'semiconductor' or 'battery' for each rebalance date.
    """
    # Formation period return (skip most recent 1 month)
    formation = sector_returns.shift(skip_months).rolling(lookback_months).apply(
        lambda x: (1 + x).prod() - 1
    )
    signal = formation.apply(lambda row: row.idxmax(), axis=1)
    return signal

# Resample to quarterly rebalance dates aligned to KRX trading calendar
# quarterly_signal = compute_sector_rotation_signal(monthly_returns).resample('QS').last()
The Concentration Risk the Back-Test Cannot Fully Resolve
We are not claiming that a two-sector rotation between semiconductors and secondary batteries is a diversified strategy — we are saying that given KOSPI 200's inherent concentration in these two clusters, any KOSPI rotation strategy implicitly takes a view on their relative performance whether or not it explicitly models the sector overlay.
The concentration creates two specific challenges for back-test interpretation. First, the two clusters are not independent: global macro conditions that drive semiconductor CapEx (server demand, memory price cycles) and conditions that drive battery demand (EV penetration rates, raw material costs) are partially correlated through risk-on/risk-off regimes and Korean won (원달러 환율) dynamics. A model that treats them as two independent sources of rotation alpha is overstating the genuine diversification the rotation provides.
Second, Samsung Electronics' absolute size creates index distortion. Because Samsung alone is 20–25% of KOSPI 200, a rotation that goes overweight semiconductors and underweight batteries is functionally a large bet on Samsung's relative performance against the rest of the index — including names in sectors that have no economic relationship to either theme. The rotation is never a clean binary trade; it is always partially contaminated by Samsung's idiosyncratic weight.
Practical Rotation Design for Concentrated Markets
Given these structural constraints, several design choices reduce the noise-to-signal ratio for semiconductor-battery rotation strategies:
- Use price-momentum on sector indices rather than individual names: Momentum computed on a sector-level equal-weight index is less subject to Samsung single-stock noise than weight-adjusted price return. KRX publishes sector index data (업종 지수) that can serve as cleaner signal inputs for sector-level rotation.
- Apply regime filters to momentum lookback: The 12-1 month formation captures trend cycles that average 12–18 months in duration for these sectors. A 6-month trailing volatility filter that widens the OOS caution threshold during elevated volatility periods can reduce the peak-cycle long positioning that created the 2022 battery drawdown.
- Report concentration exposure explicitly: A back-test that shows the sector weight and single-stock concentration at each rebalance date gives the practitioner a basis for assessing whether the rotation is concentrated in ways that the Sharpe ratio alone does not reveal.
Back-testing concentrated KOSPI sector strategies against realistic market conditions — including lot-level slippage for the large-cap names where KRX spread is thin but position sizes are meaningful — is central to understanding what these strategies actually cost to operate. Finology's platform includes sector-level rotation configuration with KRX sector code mapping and per-rebalance concentration reporting. Details on the Platform page.